


Monetary Inflation Begets Price Inflation
Don't Forget the Robots Told You This Was "Transitory"

CPI for All Urban Consumers: All Items in US City Average
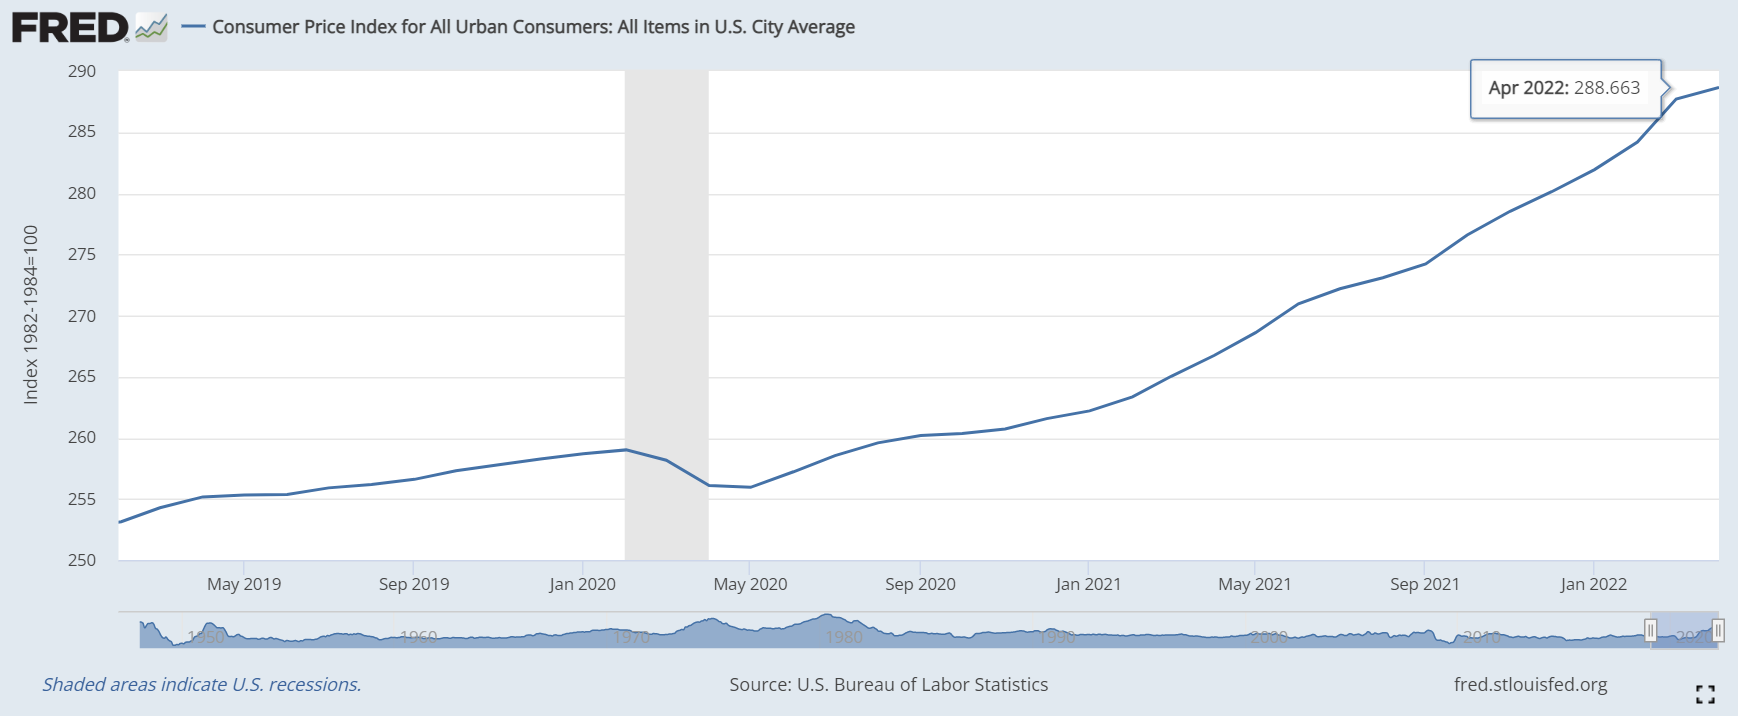
The update of the US Consumer Price Index (CPI) was released earlier this week by the Bureau of Labor Statistics (BLS)1. The index data corresponds with the start of last month — April 2022 — and continues to climb. It is now at 288.7 for all urban consumers (US city average).

This is a year-over-year change of 8.22%. This rate of change measures slightly lower than last month’s year-over-year rate of 8.56%, but your grocery bill isn’t going to notice. Although the index for gasoline fell 6.1 percent over the month, offsetting the overall CPI increase, the food index increased 9.4% year-over-year!2
Producer Price Index
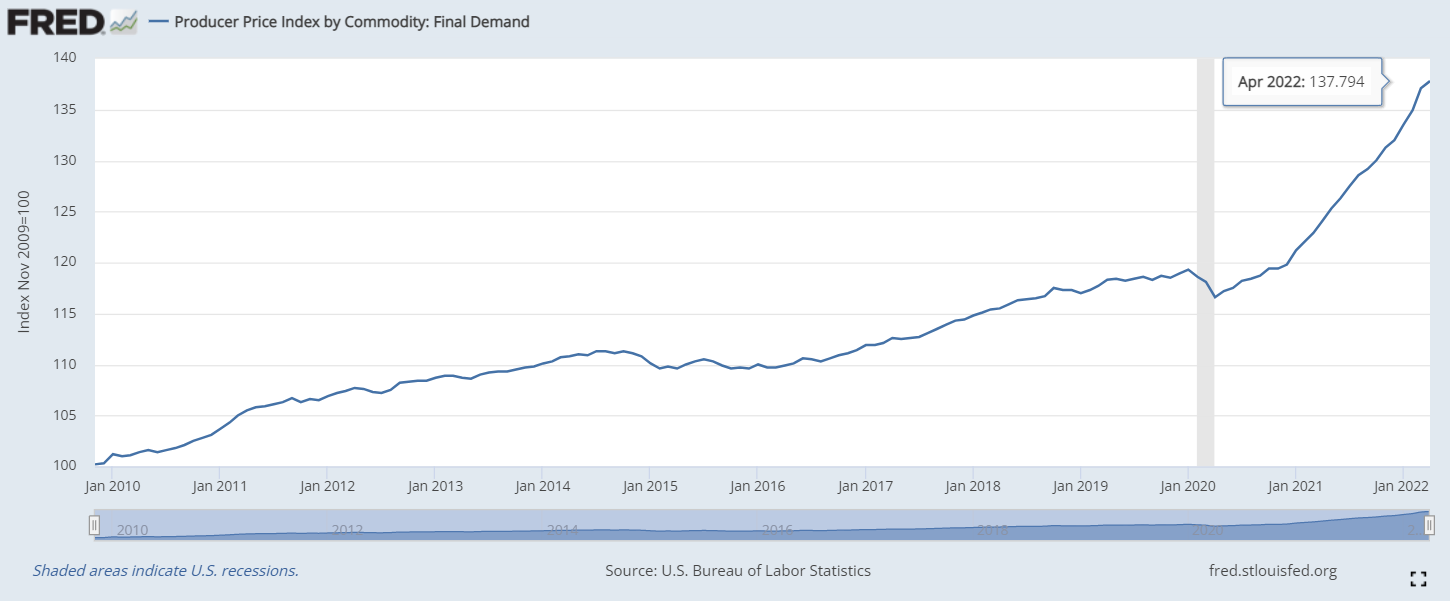
The update on the Producer Price Index (PPI) was released yesterday3. The PPI by Commodity came in at 137.8 for April 2022 (the data is a month behind). It’s a seemingly endless mountain climb into the clouds.

This PPI data point reflects an 11% year-over-year rate of change. It’s a slight dip compared to last month’s number (11.5% yoy), but still a double-digit rate.
PPI is a measure of prices from the perspective of the producer as opposed to that of the CPI, which is a measure from the perspective of the consumer. A rise is producer’s costs will naturally get passed on to consumers. So, hold on to your wallets. The mountain climb to the moon continues.
Money Supply

The change in money supply (M2) growth is still high, but it seems to be getting back to typical “norms.”4 We are starting to see the market crack with the drop in money supply growth. Of course, establishment “business reporters” don’t seem to have a clue why the cracks are surfacing and don’t even mention money supply5.
The hangover from the money high is starting to manifest. Like a drug addiction, as soon as the level of money injections start to wane, this credit-induced boom will start to break. In order to continue the high, the drug of magical money printing must continue. Nasty withdrawal symptoms will follow if money supply growth continues to fall.

The overall M2 measure is ~$22 trillion. That is a crazy number. The damage to the currency has been done and the resulting price inflation is here to stay. There’s no going back unless all that money supply disappears. Remember they told you it was “transitory.” All the media mouthpieces repeated the line like robots. Because they are nothing but robots. Think twice before parroting the next faddish talking point coming out of the establishment.