


CPI Update - 7.12% YOY
To the Moon, Alice!

CPI for All Urban Consumers: All Items in US City Average
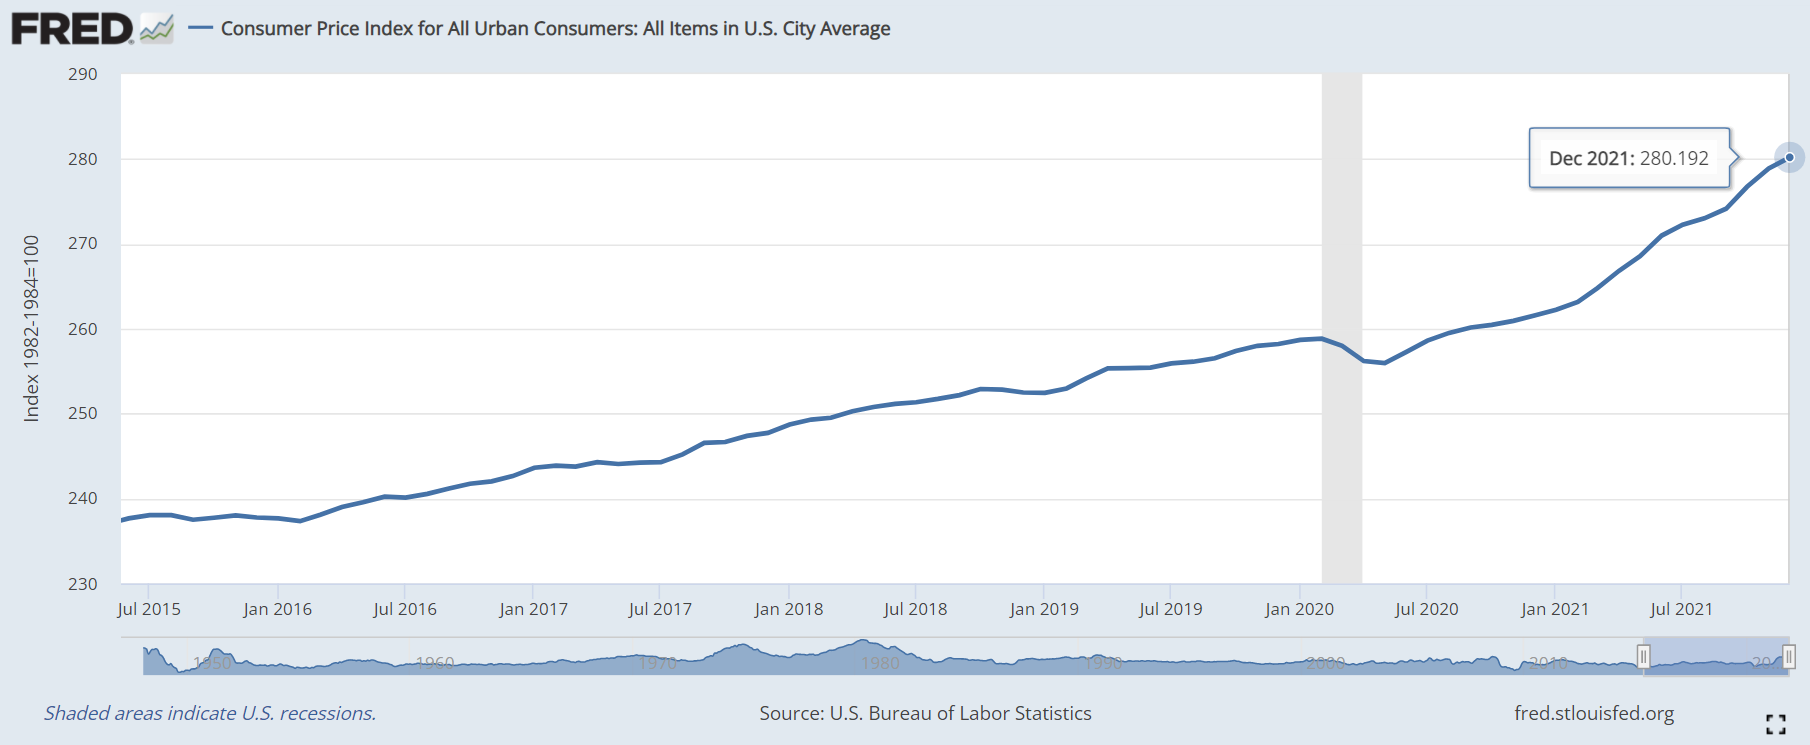
The update of the US Consumer Price Index (CPI) has been released this morning by the Bureau of Labor Statistics (BLS). The index data corresponds with the start of last month — December, 2021 — and came in at 280.19 for all urban consumers (US city average).
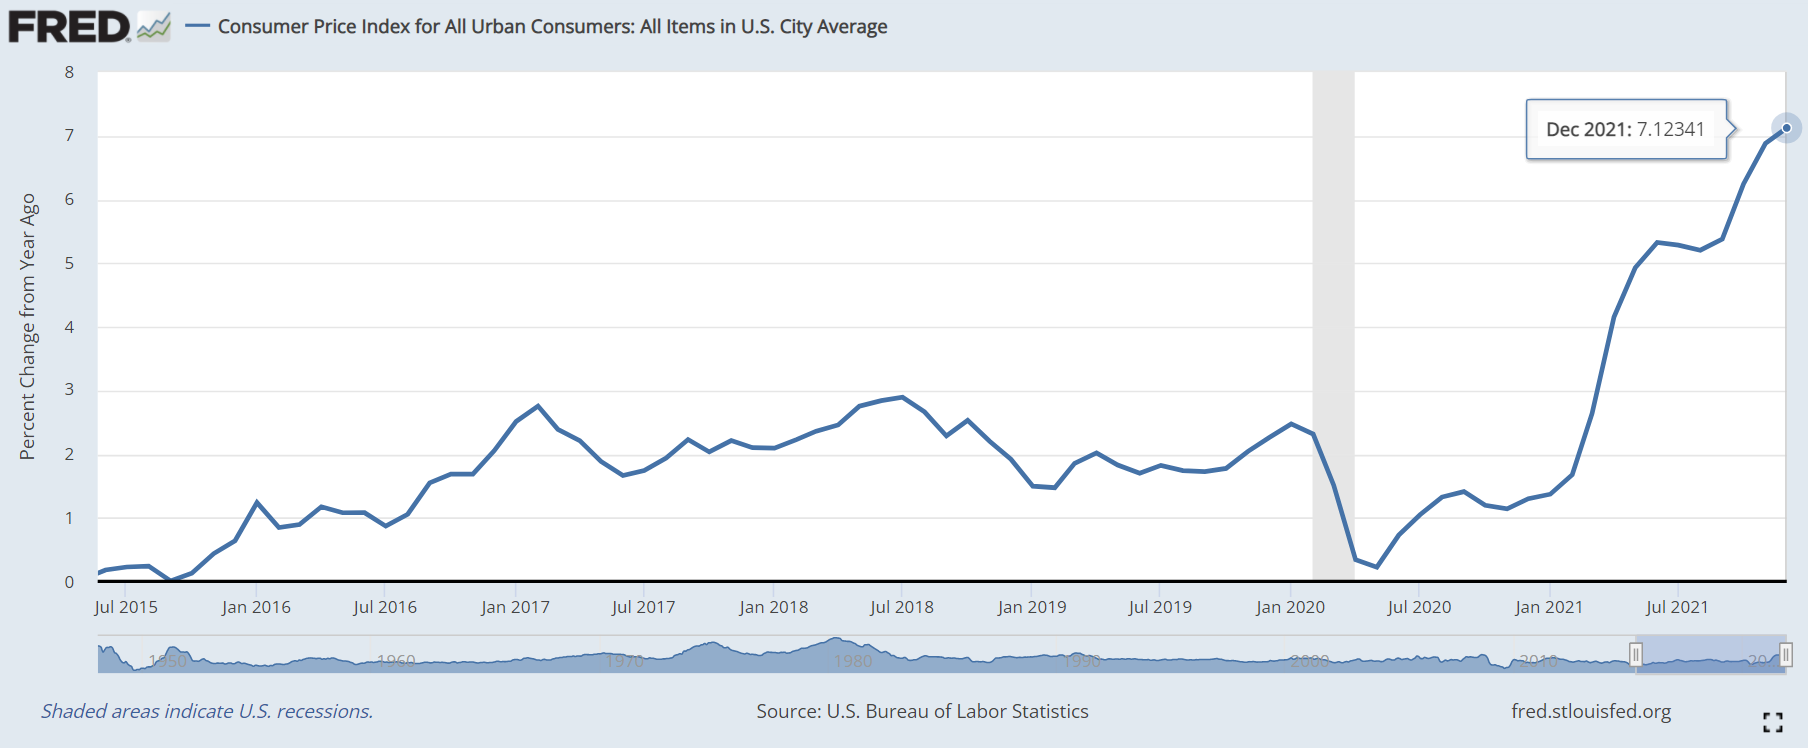
This is a year-over-year change of 7.12%. This measures slightly higher than last month’s year-over-year rate of 6.9%.
Look at that chart go. To the moon, Alice!
There are Three Types of Lies: Lies, Damn Lies and Statistics
An interesting revelation is that the BLS has updated the methodology for calculating the CPI starting January 2022. How about that! In particular, the stated change is that “weights will be calculated based on consumer expenditure data from 2019-2020.” I haven’t seen the details of the changes, but this certainly raises some eyebrows (mine at least) as to why the government is messing with the calculation at this time. Perhaps they are playing with the statistics to generate a more favorable number? Nah … they would never do such a thing!
Someone less skeptical than I might say, “well, using 2019 data seems reasonable considering the crazy world we’re living in today and the expenditure data from that time period was normal.”
But you can’t escape reality and you certainly shouldn’t ignore reality. The expenditure data of today may be different than that of “normal” times, but why ignore it?
The BLS decides what is to be considered in the CPI basket and assigns a weightage to each item depending on its “importance.” Forgive me for being skeptical of the BLS’s subjectivity. Modifying the weight of certain goods can make large increases in actual prices seem as though prices are decreasing. A deep dive into the weightage data is needed to figure out just what is being changed. But, this exercise is for another day.
The December Producer Price Index (PPI) data is scheduled for release tomorrow, January 13th. So, check back in for that update.